


Economist turned Data Journalist
I recently graduated from the Data Journalism masters at Columbia University’s Graduate School of Journalism. I used to be an economist/ teacher and almost got a PhD in Economics. I am keen to leverage my background and bring statistical methods to the newsroom as well as break down complex academic research and data analysis for the public. I like to use visuals to tell stories that are otherwise hard to understand. I mostly look for stories at the intersection of climate, economics and public policy. In addition to creating charts and maps, I like to doodle on Procreate to make my own illustrations and animations.
Climate change risk has not yet seeped into housing markets. This could be brewing trouble for the future.
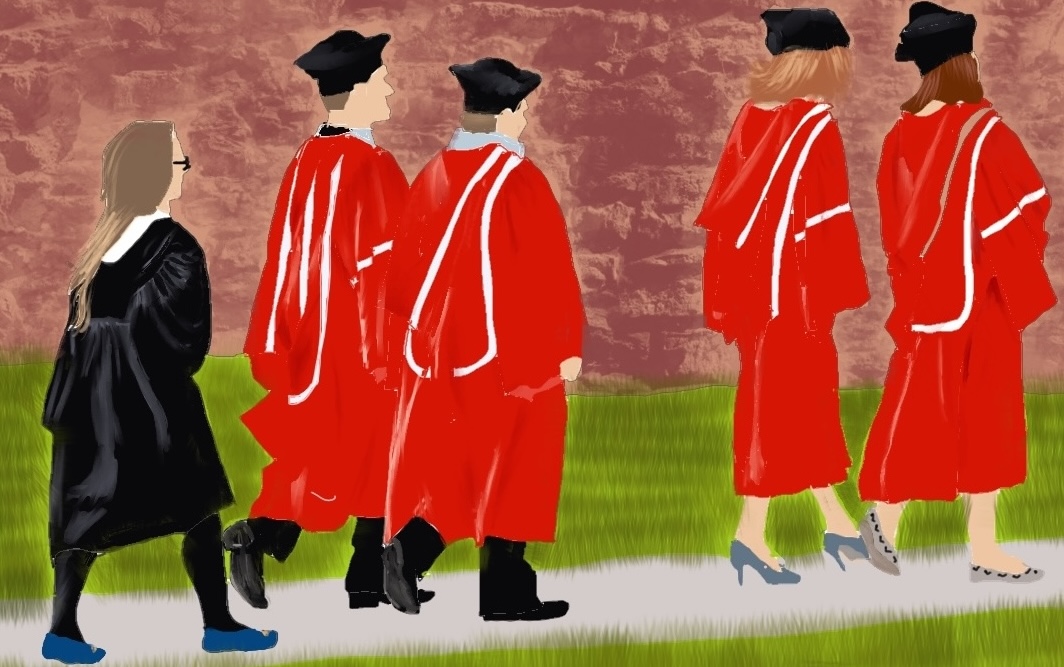
The academic job market is shrinking. Yet, the number of PhD graduates is not. What makes people still pursue a PhD?
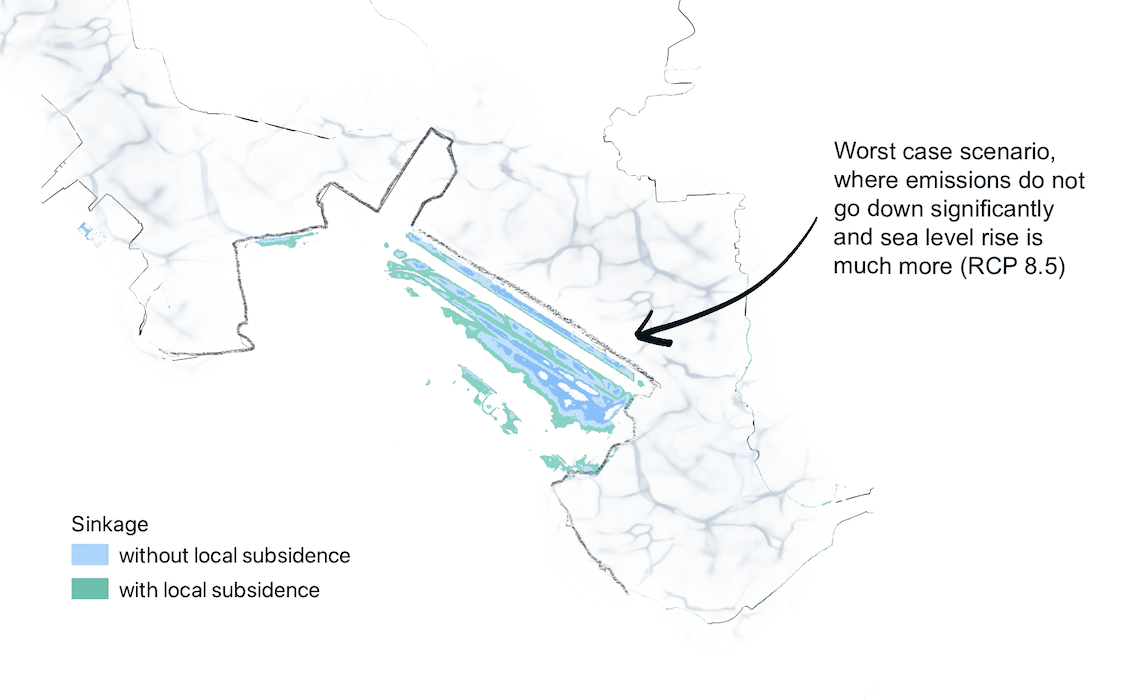
What a new scientific study reveals about the future of LaGuardia Airport.
Developing flood-prone areas can be costlier in the long run than encouraging settlement elsewhere.
Ladakh has broken out in protests against the central government’s development plans. Sonam Wangchuk’s climate-fast reminds us that the stakes are bigger than just Ladakh.
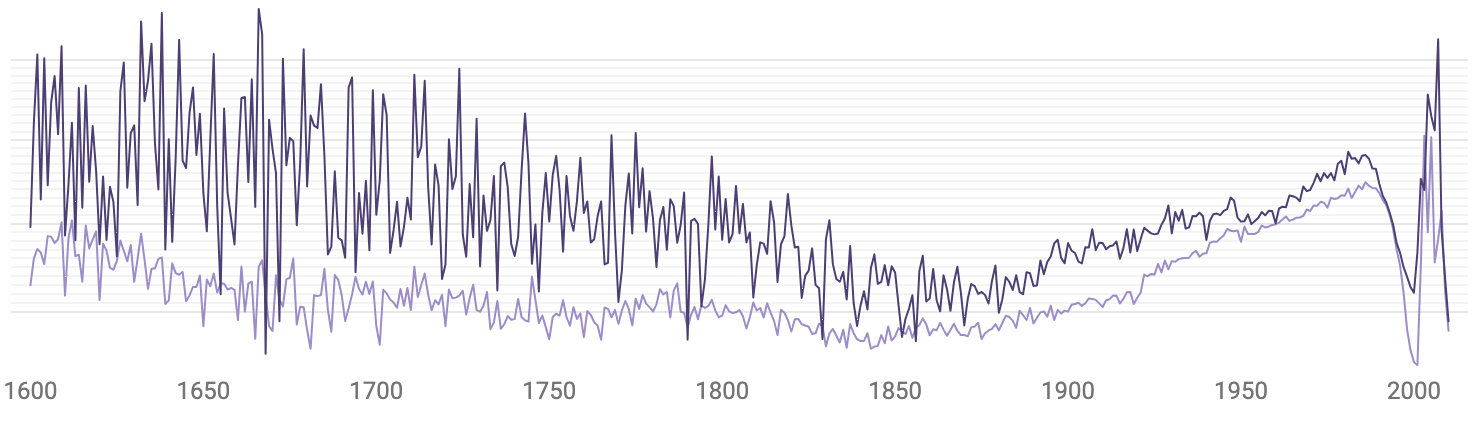
Two charts to show how history forgot women more easily than men
Scientists can’t agree upon the role of aerosols on clouds that affect severe weather. Why does it matter?
Could providing cheaper flood insurance make flood damage worse in the future?
A data curating project to get the birthplaces and Goodreads ratings of NYT bestselling authors’ since 2011.
Did democracies do better than autocracies in limiting covid deaths? A non-linear regression analysis to uncover the differences and reasons.
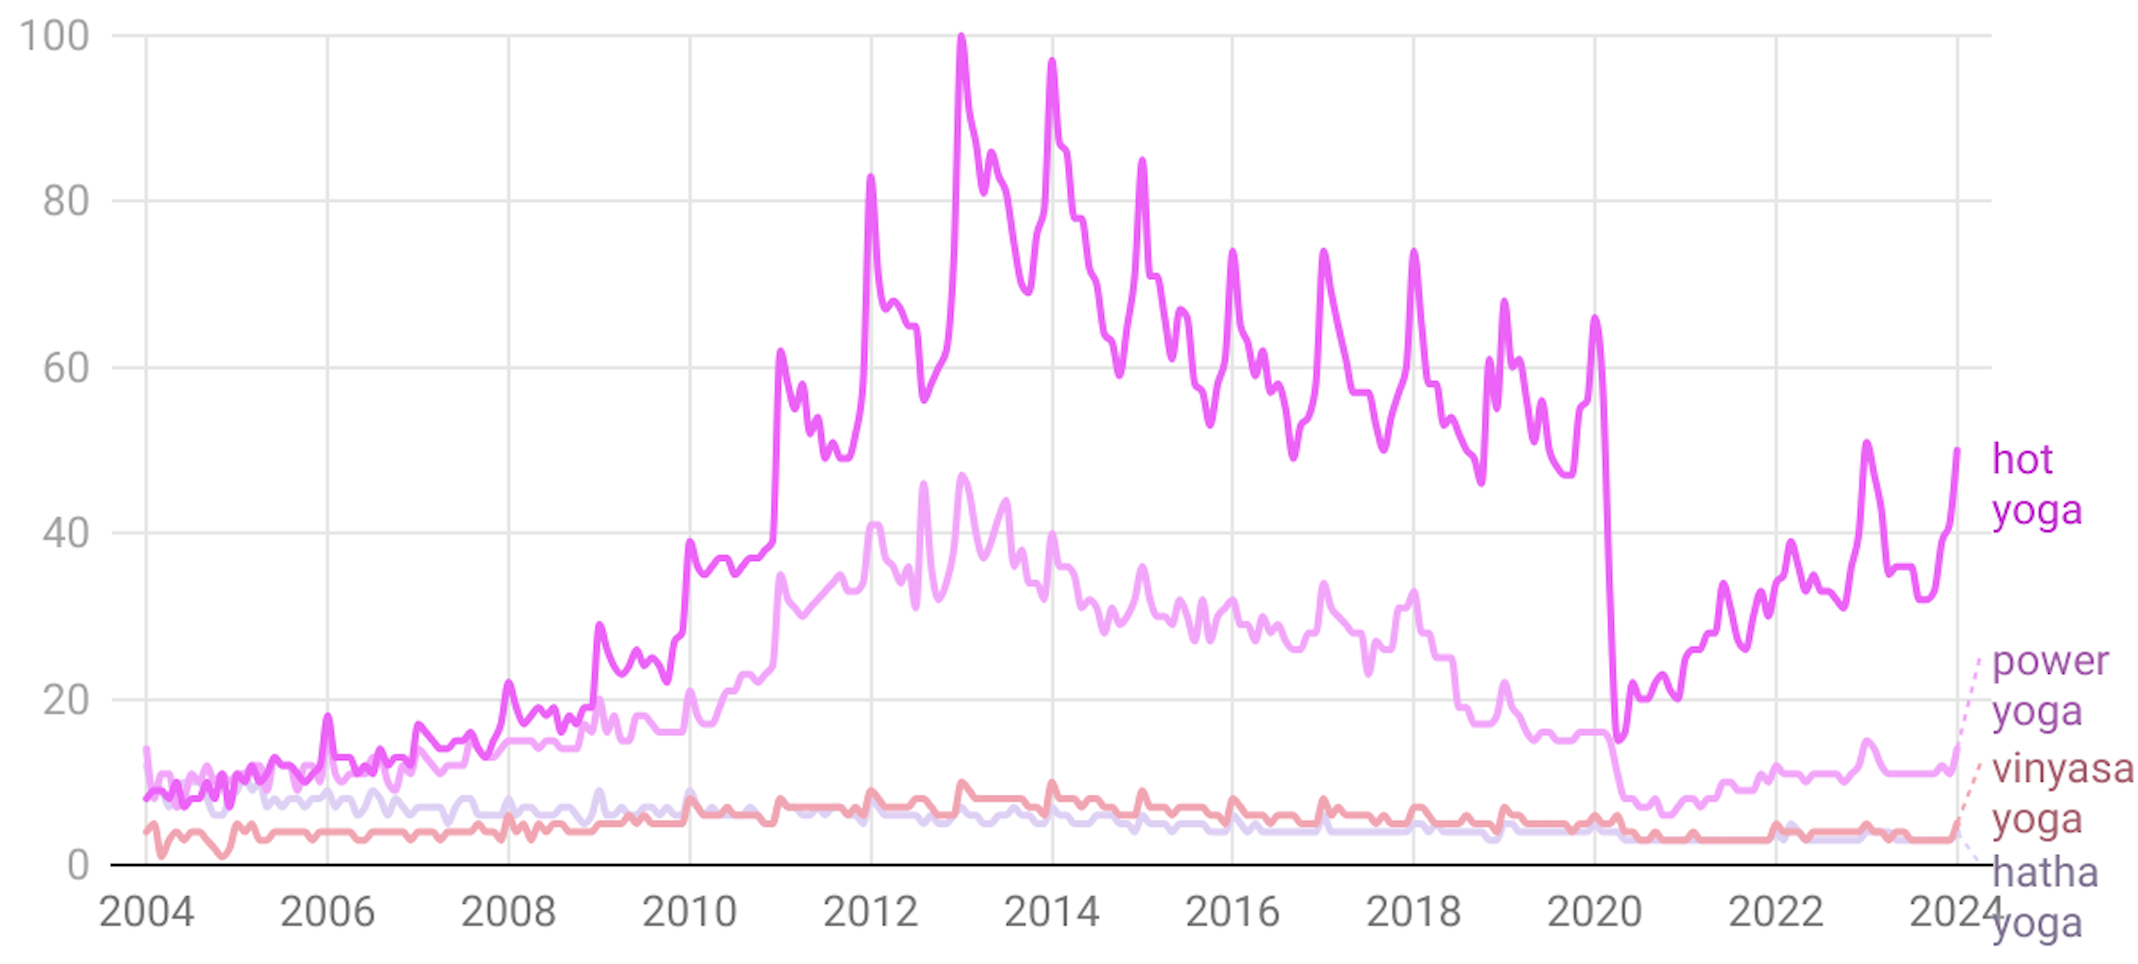
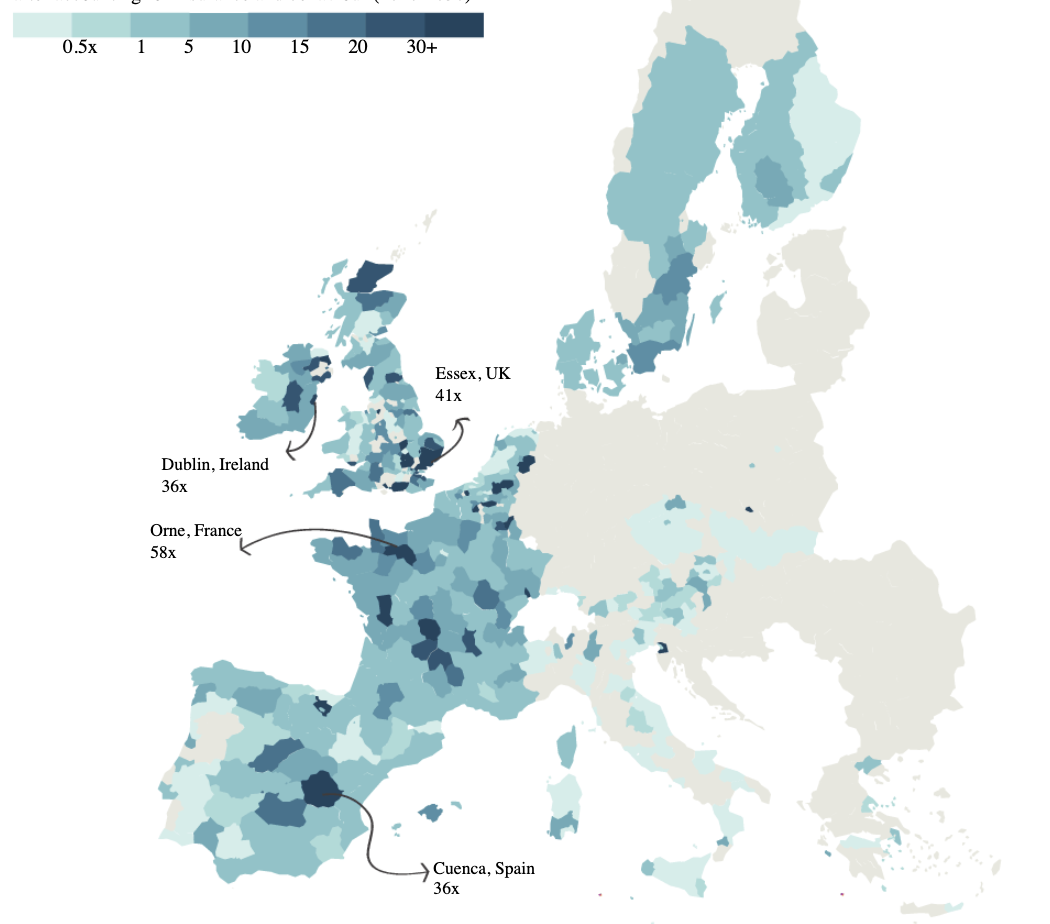
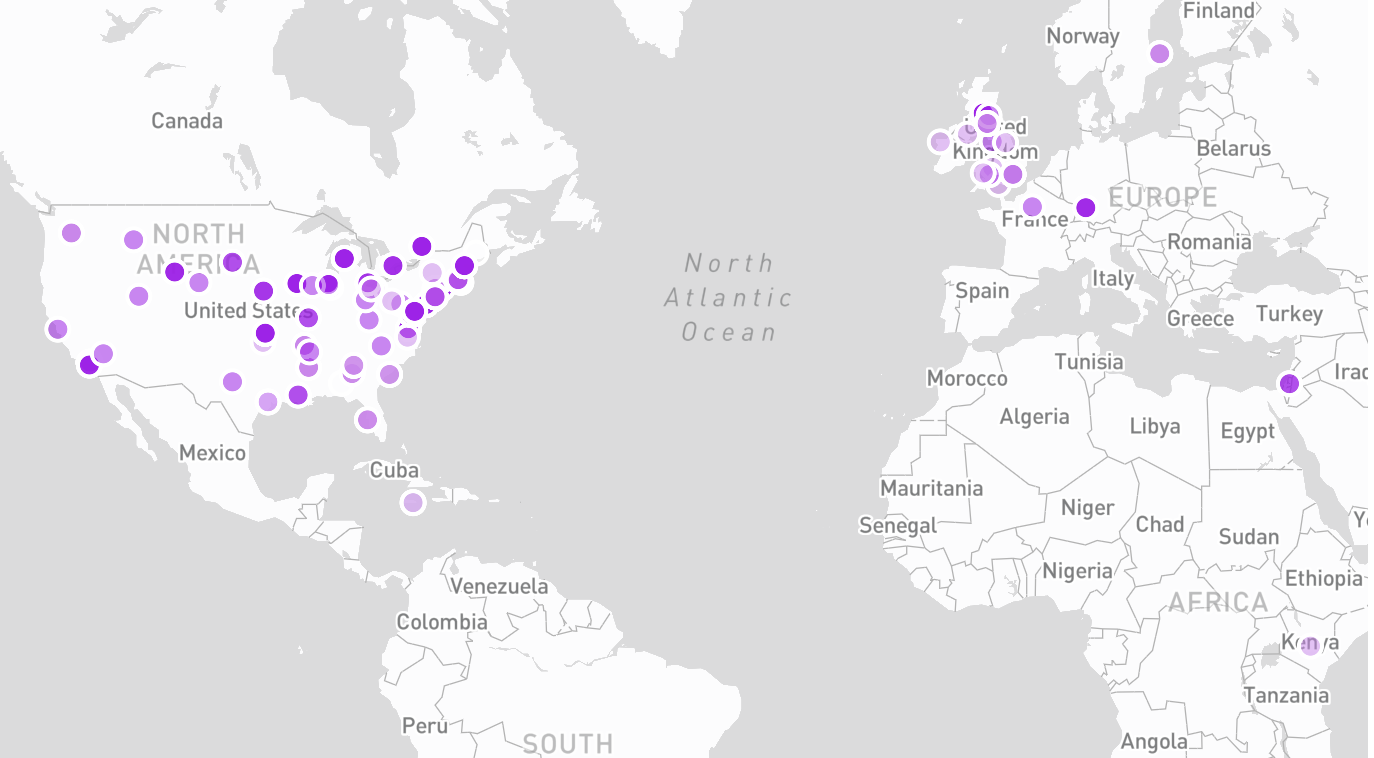
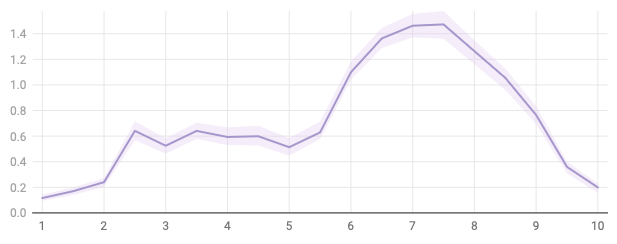
Using Google Trends data to see how yoga styles are trending in the US compared to the world.